Reports & Trending
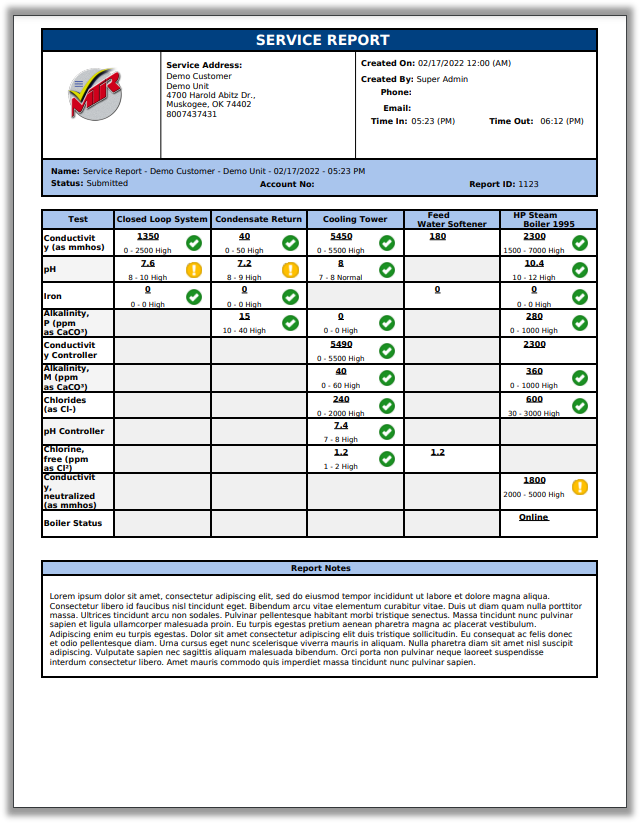
Service Reports
When it comes to service reports, they are more than just a combination of numbers and words. They serve as a powerful tool to showcase your excellence and stand out from the competition. With MyTechReports Service Reports, collecting, sharing, and communicating critical data becomes a seamless process, allowing you to effortlessly set up, create, and fulfill all your service reporting needs.
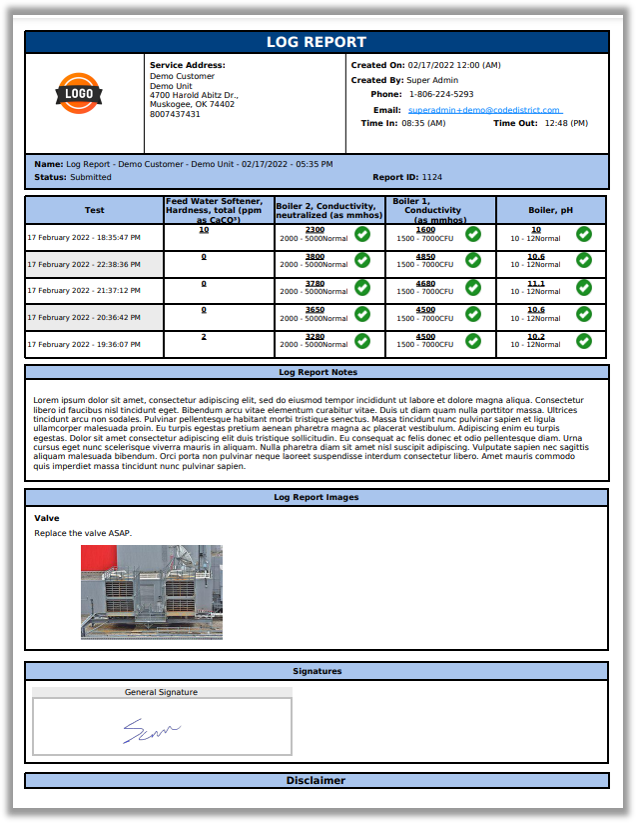
Log Reports
Log reports can be seen as either a blessing or a curse, depending on your perspective. But regardless of how you view them, one thing is certain: having reliable data over time is crucial for understanding the constant changes in your plant, system, or building. That's where MyTechReports comes in. With just a few taps on your phone, you can launch our mobile app and easily select the report you need to complete. No more dealing with cumbersome 11"x17" log reports covered in coffee stains and dead flies, only to be forgotten in a corner of the office. Embrace a new era of streamlined reporting with MyTechReports.
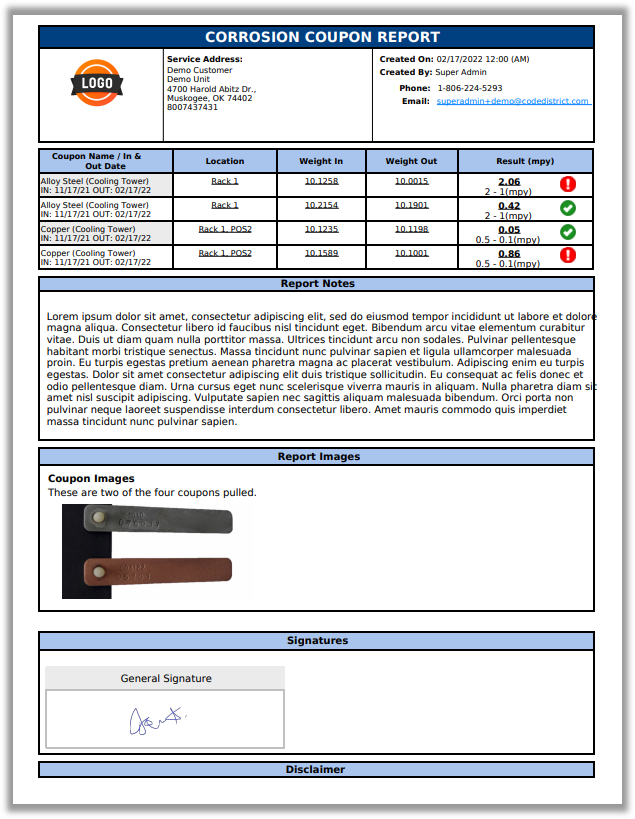
Corrosion Coupon Reports
For more than a century, corrosion coupons have been the go-to method in the industry for gaining insights into corrosion, erosion, and pitting issues within your system, machine, or building. However, interpreting the data collected from these coupons can often be misleading. That's where MyTechReports comes in. Our innovative platform simplifies the process of calculating corrosion and erosion, making it quick and effortless. Start by inputting the starting date and weight in your report, and three months later, after pulling, cleaning, and weighing the coupons, input the final data. MyTechReports instantly generates comprehensive results, giving you the opportunity to include photos, attach lab reports, and effectively explain the significance of the findings to your customers.
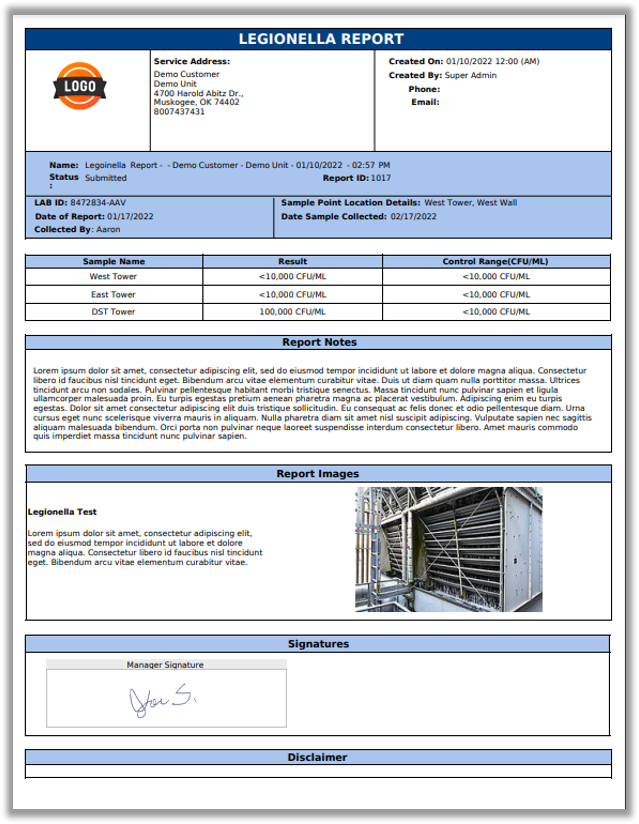
Legionella Report
The safety concerns surrounding water and Legionnaires' Disease have always been a significant issue. In 1976, during the first major outbreak that gave the disease its name, 182 members of the American Legion were infected, and tragically, 29 of them lost their lives. Since then, numerous industrial measures have been implemented to minimize the risk of exposure to Legionnaires' Disease. MyTechReports provides a comprehensive platform that consolidates all the regulatory requirements, allowing you to effortlessly correlate ORP readings to CFU counts and compare them to historical chlorine levels. With MyTechReports, you can have peace of mind knowing that you are fully protected, your team has diligently fulfilled their responsibilities, and your clients can trust that safety measures have been meticulously executed and communicated.
View our Web Demo
To view our web demo, submit your information in the Demo Form.
In this demo you will see how to:
- Create Tests
- Create Panels
- Add Customers
- Add Units
- Add Report Templates
- Add Panels to Templates
- Configure Report Recipients
- Create and Email your Report

Want to view a Web Demo? Submit your information below and view it immediately.
Trending Reports
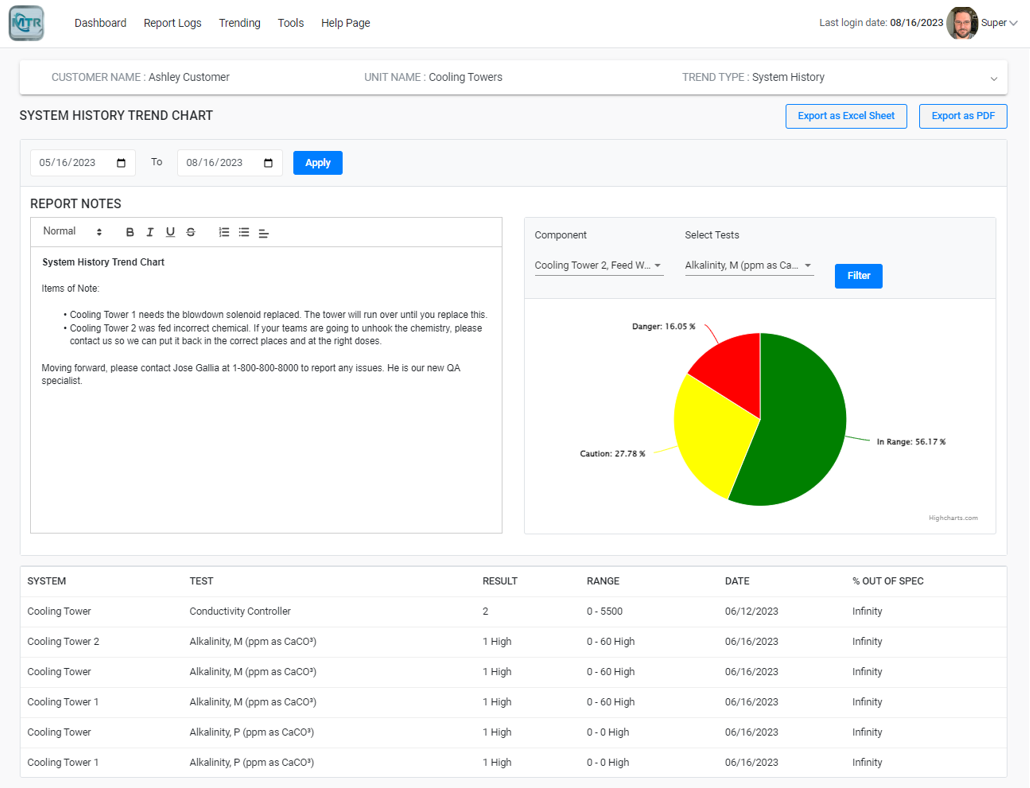
System History at a Glance
Effortlessly explore the comprehensive performance of your treatment program with MyTechReports. Simply load a System History report, choose a date range, and unlock a treasure trove of insights. We will dive deep into every aspect, highlighting your triumphs as well as areas for improvement. Our results are categorized as In Range, Slightly Out of Range, and Highly Out of Range, giving you a crystal-clear understanding of your progress. Export to Excel or PDF as desired.
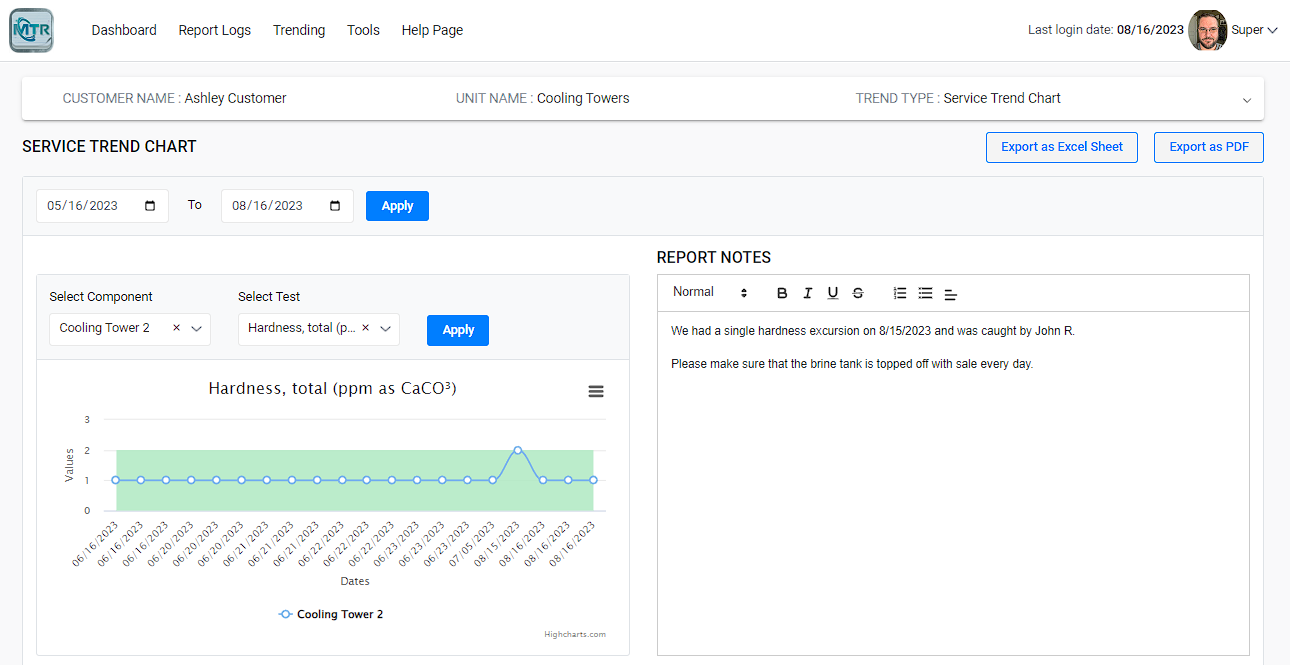
Easy to Understand Charting and Trending
Discover the incredible capabilities of MyTechReports Trending Charts, where you can effortlessly visualize and analyze any Service, Log, or Coupon report results. Simply choose your desired date range, system component, and test, and witness as the system generates a visually striking graph showcasing trends spanning the past 90 days. With the added convenience of exporting the graph to PDF or Excel, exploring and sharing your data has never been more seamless.
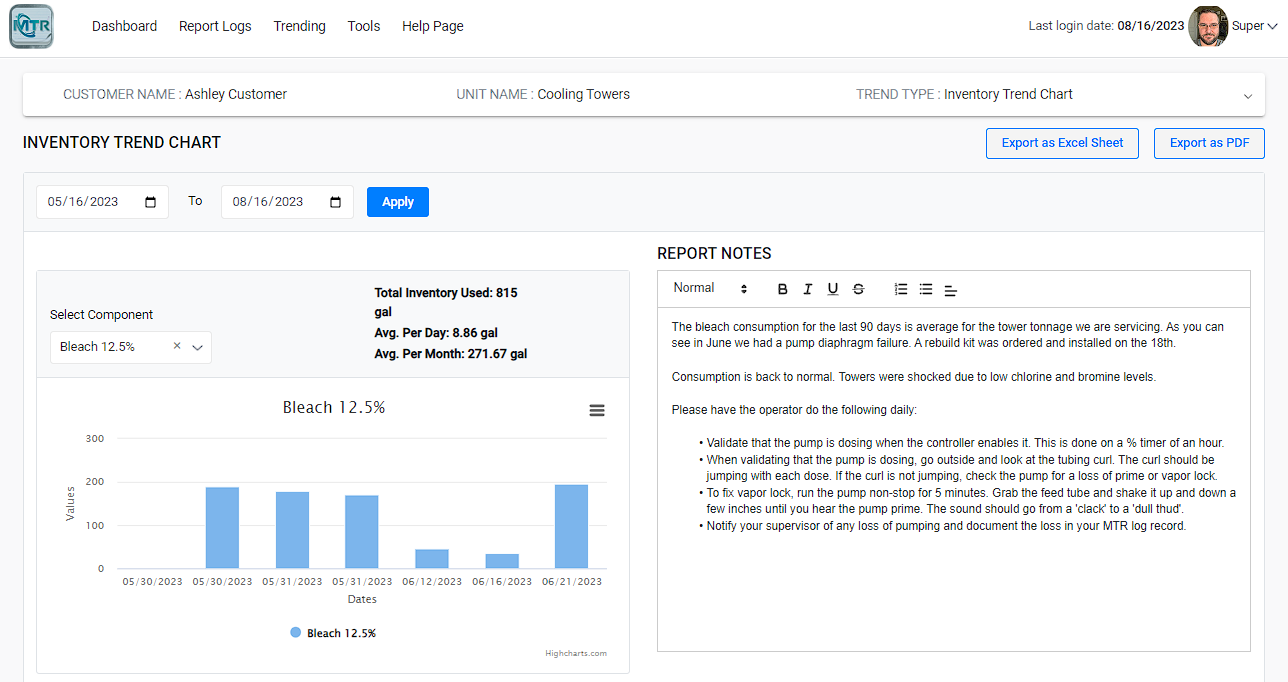
Inventory Consumption Trending
Keep tabs on your chemical usage trends with MyTechReports. Our user-friendly interface allows you to effortlessly select the desired date range, track specific chemicals, jot down notes, and conveniently export data to PDF or Excel. Stay in control of your inventory consumption with our intuitive charting system.
